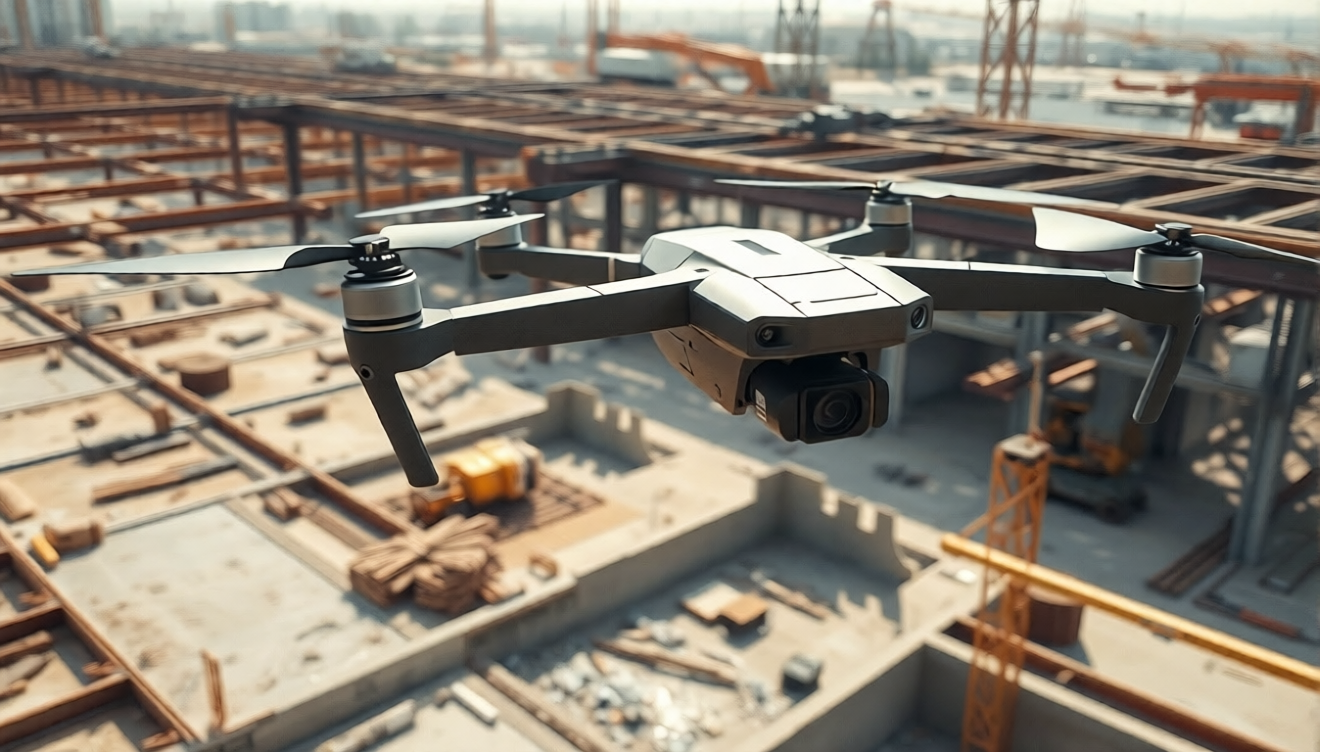
Construction drone mapping means flying a drone over a job site, capturing overlapping images, and processing them into accurate maps, surface models, and volume measurements. Service providers can run that processing in the cloud, so no GPU workstation is needed.
This guide covers capture settings, outputs, workflow, and how to compare tools for earthwork, progress monitoring, and stockpile jobs.
Ready to process your first site? Start with Aeroyantra’s construction workflow.
What Drone Mapping for Construction Delivers
A mapping flight turns hundreds of overlapping photos into measurable, georeferenced data. For contractors and engineers, that data replaces slow ground walks and gives everyone the same current picture of the site.
Drone mapping for construction is most often used for:
- Progress monitoring against schedule
- Earthwork tracking, including cut and fill
- Stockpile volumes in cubic yards
- Pre-construction site surveys and existing conditions maps
- Site logistics and haul road planning
- As-built documentation for clients and owners
Most of these jobs use an RGB camera. Projects that need bare-earth terrain under vegetation may call for LiDAR, so confirm which data types your processing platform supports before you quote that work.
Typical Construction Mapping Jobs
Independent providers and survey firms tend to see a few repeat job types.
Progress monitoring. The client wants a regular, comparable map of the site. You fly the same area on a set schedule and deliver an updated orthomosaic and surface model each time.
Earthwork and cut and fill. The client needs to know how much material has moved. You compare a surface model against a design surface or an earlier flight to calculate cut and fill volumes.
Stockpile volumes. Aggregate, soil, and spoil piles are measured and reported in cubic yards. These jobs often repeat monthly.
Pre-construction survey. A baseline map of existing conditions helps with planning, grading design, and bids.
Site size varies from a few acres to several hundred. Plan battery swaps and flight blocks to match.
Data Capture Tips for Site Mapping
Good processing starts with good capture. A few settings matter more than the rest.
Overlap
A common starting point is about 75 percent front overlap and 70 percent side overlap. Sites with bare soil, gravel, or repeating surfaces can be hard for software to match, so many pilots raise overlap there. Run a short test flight and review the result before committing to a large site.
Flight height
Many site mapping flights fall between 150 and 300 feet above ground level. Lower altitudes give finer detail but need more images and more flight time. In the US, Part 107 rules generally cap flights at 400 feet above ground level, so confirm current FAA requirements for your operation.
Ground control points and RTK or PPK
For earthwork and volume work, add ground control points. Place them around the site edges and across the interior, and avoid areas where heavy equipment will drive or dump material.
If your drone supports RTK or PPK, you may need fewer control points. Many providers still survey a few independent checkpoints so they can verify accuracy and report it to the client.
Site conditions
- Fly in steady light when possible to reduce shadow shifts between images.
- Coordinate with the site manager so crews and equipment are clear of the flight area.
- Keep control point locations consistent across repeat flights so progress maps stay comparable.
Outputs and Deliverables for Contractors
Clients rarely want raw files. They want something they can read, measure, and share with their team.
Typical deliverables include:
- Orthomosaic: a georeferenced, measurable image of the whole site
- Digital surface model (DSM): elevation values across the site
- Contour lines: a familiar format for grading and drainage review
- Point cloud: useful for detailed terrain and structure review
- Volume reports: stockpile and cut and fill figures in cubic yards
- CAD and GIS exports: for engineers who work in their own design tools
Ask early which formats the client uses. Many contractors only need a PDF map and a volume summary, while engineers may need files for CAD or GIS software.
Workflow: From Upload to Export
Cloud processing keeps the workflow simple. Here is the typical path.
- Capture. Fly the site with the overlap and height settings above. Survey control points if the job requires them.
- Upload. Add the image set to your project from any computer with an internet connection. Large sites mean large uploads, so a stable connection helps.
- Add control data. If you used ground control points or RTK/PPK data, include them so results are tied to real-world coordinates.
- Process. The platform runs photogrammetry on remote servers. You do not need a high-end GPU or a dedicated processing machine. See the cloud processing features for supported outputs.
- Review. Check the orthomosaic for gaps or blur. Check elevation near control points before you trust any volume.
- Export. Download the outputs your client asked for and deliver them in their preferred format.
A common mistake is skipping the review step. Catching a gap while you are still on site is much cheaper than a return trip.
Calculating Cost per Acre
Cost per acre is the number that makes tools comparable. The formula is simple:
- Cost per acre = total processing cost for the period divided by acres processed in that period.
Build your own figure with these inputs:
- Your monthly or per-project processing charge
- Total acres processed
- Any extra storage or add-on charges
- Hardware costs, if you process on your own machines
For example, if you pay a fixed amount for a month and map more acres, your per-acre cost drops. If you pay per project and your sites are small, it may rise. Repeat monitoring jobs add up quickly, so run the math on your real flight schedule. Check current rates on the Aeroyantra pricing page.
How to Choose the Best Drone Mapping Software for Construction
Providers compare tools such as Pix4D, DroneDeploy, Agisoft Metashape, Propeller, Bentley, and WebODM. Each has real strengths, and the right pick depends on your work and your clients.
Use these criteria:
- Cost per acre: calculate it for your actual monthly volume
- Turnaround: how long you wait from upload to usable output
- Accuracy: how well results hold up against your checkpoints
- Hardware: whether you need a GPU workstation or can process in the cloud
- Outputs: whether volumes, contours, and exports match your deliverables
- Support: how quickly you can get help during a deadline
Test any tool on a dataset you already know. Compare its output against your checkpoints rather than relying on a marketing claim.
When Aeroyantra may not be the right fit
If you want fully offline processing, or you already own a powerful workstation and prefer desktop control, a desktop tool may suit you better. If your workflow depends on a tool or output that a platform does not list, confirm support first.
Aeroyantra is built for providers who want cloud processing without GPU hardware and a self-serve way to get maps and volumes out the door.
Start Mapping Construction Sites in the Cloud
Construction drone mapping works best when capture is consistent and processing is predictable. Fly with solid overlap, add control where volumes matter, and deliver outputs your clients can use right away.
Create your account and process your first construction project with Aeroyantra.
Frequently Asked Questions
What is construction drone mapping?
Construction drone mapping means flying a drone over a job site, capturing overlapping images, and processing them into maps and models. Common outputs include orthomosaics, surface models, contours, and volume reports. Contractors use them for progress monitoring, earthwork tracking, and stockpile measurement across the site.
How much overlap do I need for site mapping?
A common starting point is about 75 percent front overlap and 70 percent side overlap. Bare soil and gravel can be hard to match between images, so many pilots raise overlap on those sites. Check your processing software guidance and run a short test flight before committing to a large area.
Do I need a GPU computer to process construction drone maps?
Not with cloud processing. Desktop photogrammetry tools often benefit from a powerful GPU and plenty of memory, while a cloud platform runs the heavy work on remote servers. You upload images from any computer with an internet connection, then download finished outputs when processing completes.
Can drone mapping calculate stockpile volumes and cut and fill?
Yes, when the surface model is accurate and tied to good control. Volumes are calculated by comparing the surface against a base surface or an earlier flight. Results are usually reported in cubic yards. Verify accuracy against surveyed checkpoints before sharing any volume figure with a client.
How do I calculate cost per acre?
Divide your total processing cost by the acres you processed. If a plan costs a set amount per month and you process a known number of acres, the result is your cost per acre. Compare that figure across tools, and include any hardware or extra storage costs in the total.